In our previous blog we looked at surging electricity prices, particularly in South Australia. One possible reason is an increase in the volatility of operational demand; i.e. electricity drawn from the grid by consumers, but excluding electricity generated from unmeasured source such rooftop solar systems and other small-scale generating sources.
Volatility in the output from these unmeasured sources, which has been increasing in absolute and relative terms, would lead to greater demand volatility, which may in turn impact on energy prices in the spot market.
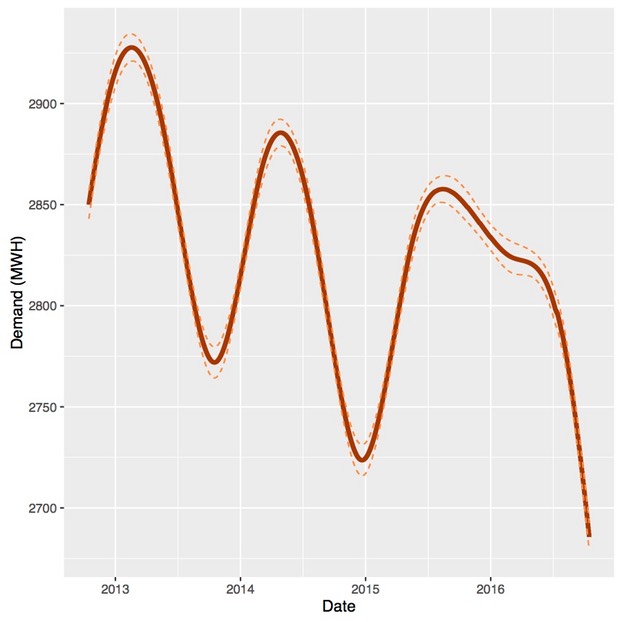
We can look at the trend in the level and volatility of operational demand in the same way we looked at prices using an optimised smooth. The trend in South Australian electricity demand is shown in Figure 6. The figure shows a seasonal component, but also a steady decline in trend, which, at least in part, would be due to an increase in the deployment of rooftop solar systems.
Figure 6. The trend in electricity demand in South Australia: 15 October 2012 through 15 October 2016
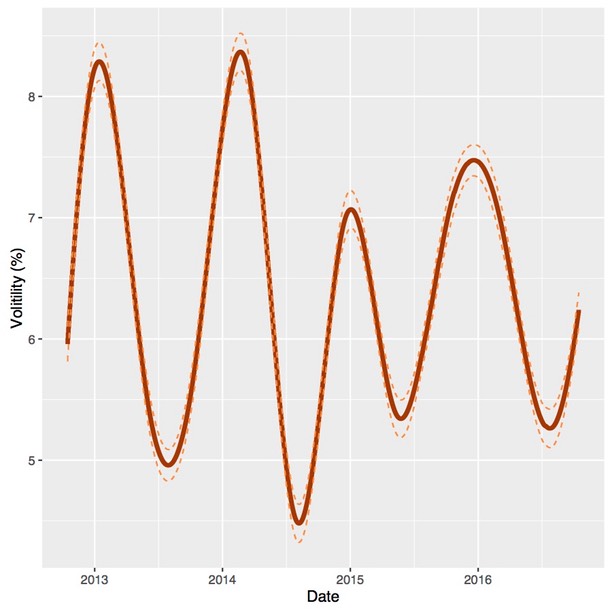
The trend in volatility, as measured by the absolute mean percentage error about the trend in demand, is shown in Figure 7. There is a slight decline in volatility over the period but in any case, there has not been an appreciable increase, so it appears that the increase in price volatility is not due to demand or volatility of unscheduled generation including rooftop solar. However, solar generation is diurnal so it would be useful to check if the variability of the diurnal trend has increased.
Figure 7. The trend in the volatility of demand in South Australia; 15 October 2012 through 15 October 2016
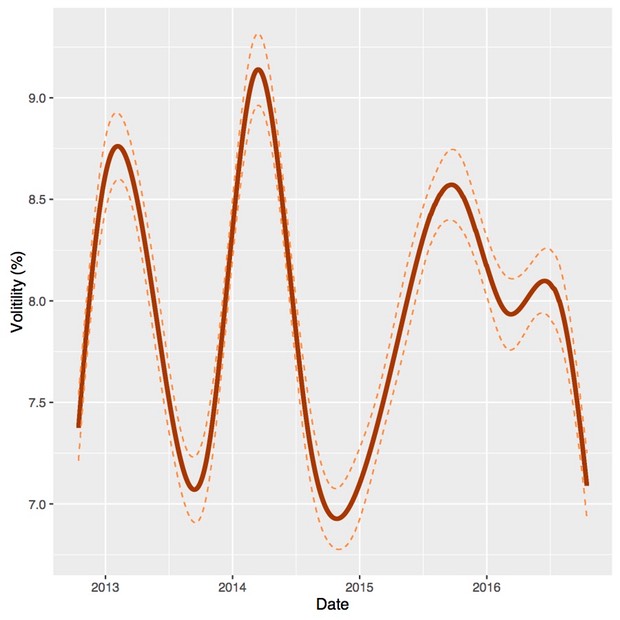
We can do this by fitting a linear regression model with time, on a half hourly scale, as a factor (dummy variable. We can the extract the trend in absolute values of the residuals about the diurnal pattern in demand. This is just another measure of volatility, expressed as percentage of the mean predicted diurnal trends, and is shown in Figure 8. There is a modest but steady decrease in the volatility of demand about the diurnal trend. In any case, the conclusion that the variability of rooftop solar, or other non-scheduled generation, has been responsible for the increased variability in prices is clearly not supported. The volatility in demand about trend is no greater that what has been observed in previous years.
Figure 8. The trend in volatility about the diurnal trend in demand in South Australia; 15 October 2012 through 15 October 2016