The next instalment of the blog is still in progress but we thought it would be good to update the changing electricity price distributions for South Australia, New South Wales and Victoria.
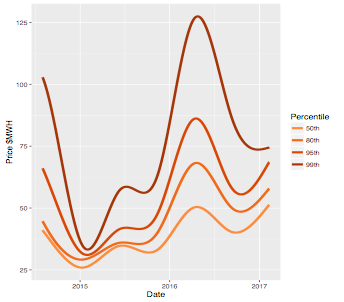
Percentiles of the distribution are shown in each figure from August 2014, after the repeal of the carbon tax, through to February 8th 2017. The percentiles were estimated using local quantile regression. The beginnings of the upper percentiles (the 95th and 99th) are influenced to some extent by the carbon tax and the endpoints should be regarded with some caution.
The escalation in the upper tail of the distribution since the start of 2016 is clear in each of the NEM regions. The fact that the shoulders of the distributions are moving away from the median as well as the tails indicates that price volatility has had a substantial impact on average prices.
The escalation of the tails in New South Wales is of the same order of magnitude as South Australia. In Victoria, it is less pronounced but there is a clear upturn that starting in late 2016
Figure 1. Percentile of the wholesale electricity price distribution in South Australia: August 1 2014 to February 8 2017.
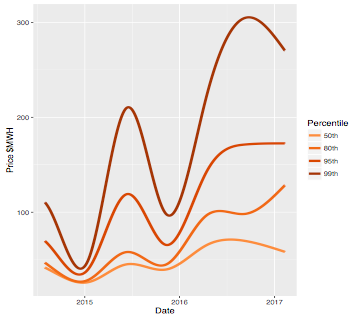
Figure 2. Percentile of the wholesale electricity price distribution in New South Wales: August 1 2014 to February 8 2017.
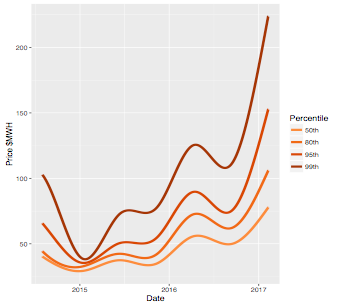
Figure 3. Percentile of the wholesale electricity price distribution in Victoria: August 1 2014 to February 8 2017.